German Traffic Sign Classifier
Programming Language :
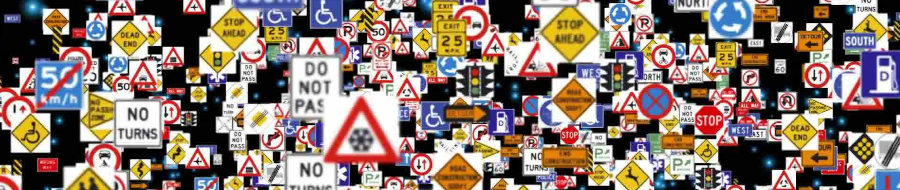
Object detection and its classification plays a major role in self-driving vehicles. In this project, we will try to classify traffic signs. We will look at object (traffic sign) detection in some other project and then try to combine both of them.
The purpose of this project is to:
- Download dataset from Kaggle.
- Exploratory Data Analysis (EDA)
- Train Classifier
- Create a standalone application to deploy our model
- Test model using the deployed application
Notebook Servers
We will need GPU to train our image classifier, so we will be using Gradient. With Gradient, we get access to a Jupyter Notebook instance backed by a free GPU in less than 60 seconds, without any complicated installs or configuration. Gradient is built on top of Paperspace, a GPU-accelerated cloud platform.
Refer to this link to get your gradient instance up and running.
With the free tier from Gradient, we get 8 CPU 30 GiB RAM Quadro M4000 (8GB GPU) for up to 6 Hrs
This free tier is more than sufficient for our project.
Download Dataset
We will be using the GTSRB - German Traffic Sign Recognition Benchmark | Kaggle dataset. The German Traffic Sign Benchmark is a multi-class, single-image classification challenge held at the International Joint Conference on Neural Networks (IJCNN) 2011.
Once we have started our notebook instance from Gradient, we can use this notebook to download data from Kaggle to gradient storage. This notebook outlines all the steps required to download competition datasets from Kaggle.
Note: One can update the Kaggle API and can download data for any competition using this notebook.
Exploratory Data Analysis (EDA)
All the codes used to analyze the dataset can be found here.
The downloaded data has a Meta folder which contains reference image for each class. We combined these images with their sign names to get a better idea about these traffic signs.
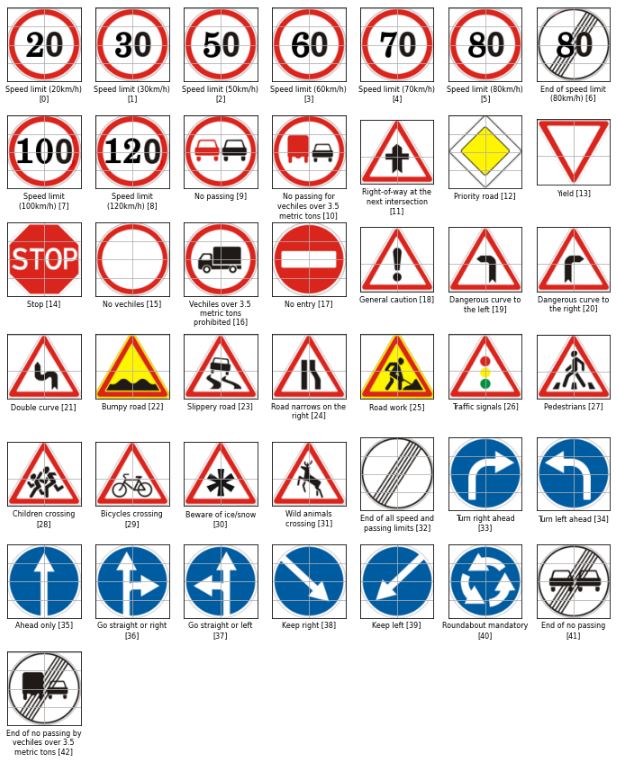
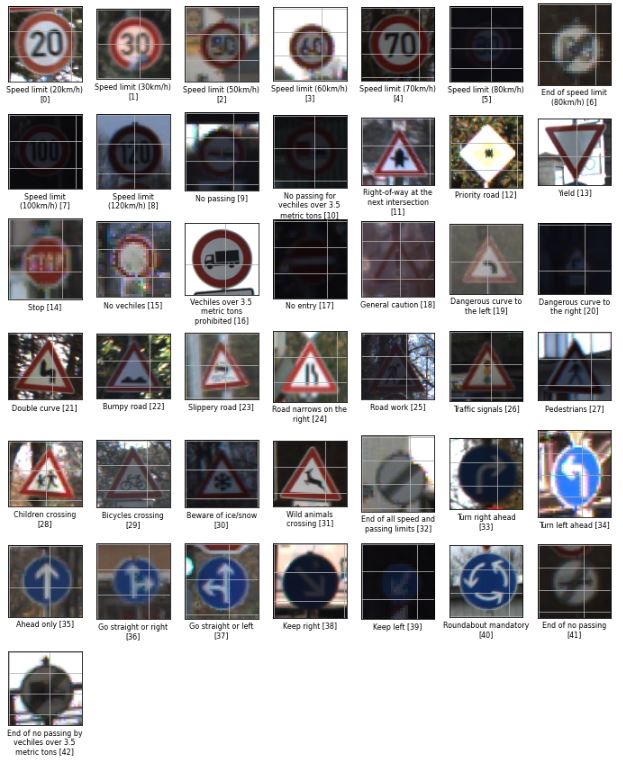
Let’s look at one image from each class in the training set.
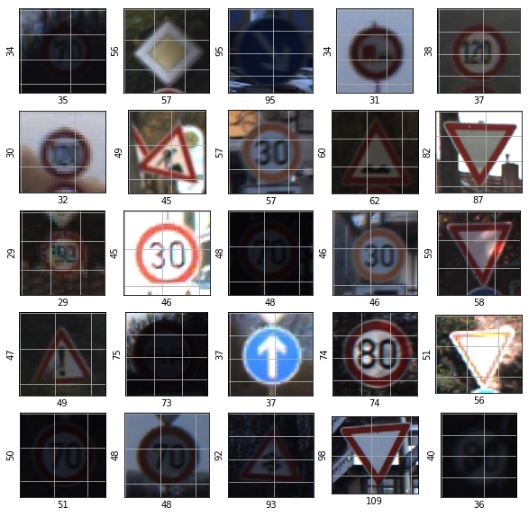
Now Let’s check what we have in test set. The numbers on the x-axis and y-axis represent the image size.
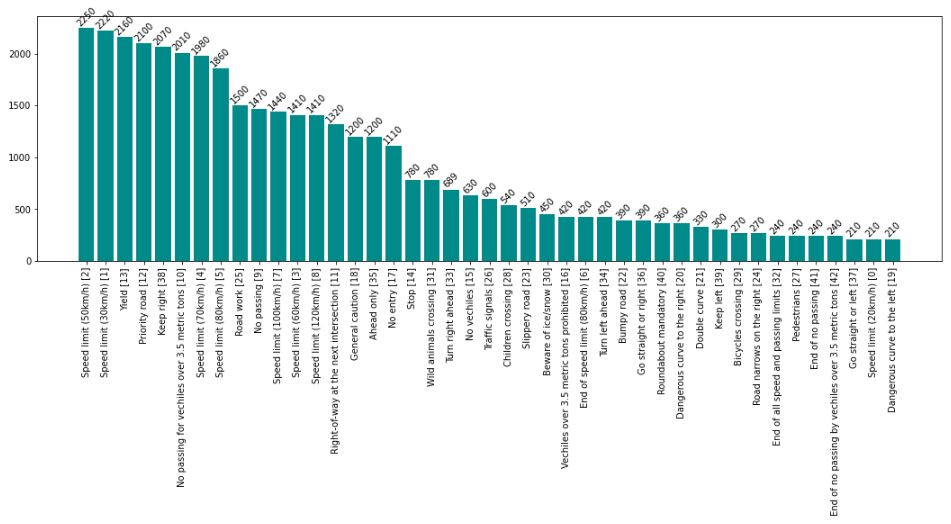
Below is the class distribution of images. This is highly imbalanced data. We will first create our model on this data, check its performance, and then we will look at the class imbalance(if required).
Train Classifier
We will use Convolutional Neural Network (CNN) classifier to train our model. There is no point in training the model from scratch, so we will use a pre-trained architecture (resnet34) and use transfer learning capabilities. I wrote an article on transfer learning, do have a look.
The notebook used for training our classifier can be found here.
We considered 20% of the data for the validation set and fine-tuned the model for 15 epochs. Below are the results on the validation set.
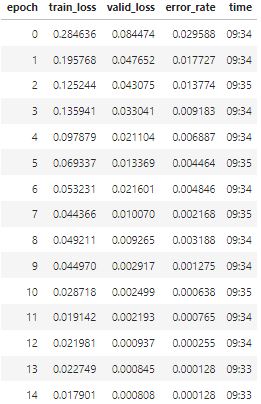
We can see that both the training and the validation loss are decreasing with each epoc which is a good sign as our model is not overfitting, and we have a highly accurate model.
We saved this model and will use it on images from the test set using our standalone application.
Create a standalone application to deploy our model
Due to limited knowledge in the field of UI development, most Data Scientists rely on Front-end developers to create a prototype so that their work can be easily consumed by different stakeholders (even the non-technical ones). This takes more time, and sometimes it’s not feasible to get a resource to create prototypes.
Now with the help of ipywidgets, voilà and Binder, a data scientist can create a standalone web application in Jupyter notebook, deploy it and showcase their work. Once the application is deployed its URL can be shared with different stakeholders.
The notebook used for creating the application can be found here.
Note: At this moment this application is taking one image at a time, but one can definitely modify it based on their requirements.
Once we created our application in jupyter notebook, we can push our jupyter notebook containing the application along with the trained model to GitHub and use this repository in binder to deploy our application.
Refer this blog to get more details about turning a Jupyter Notebook into a Standalone Web Application using Binder.
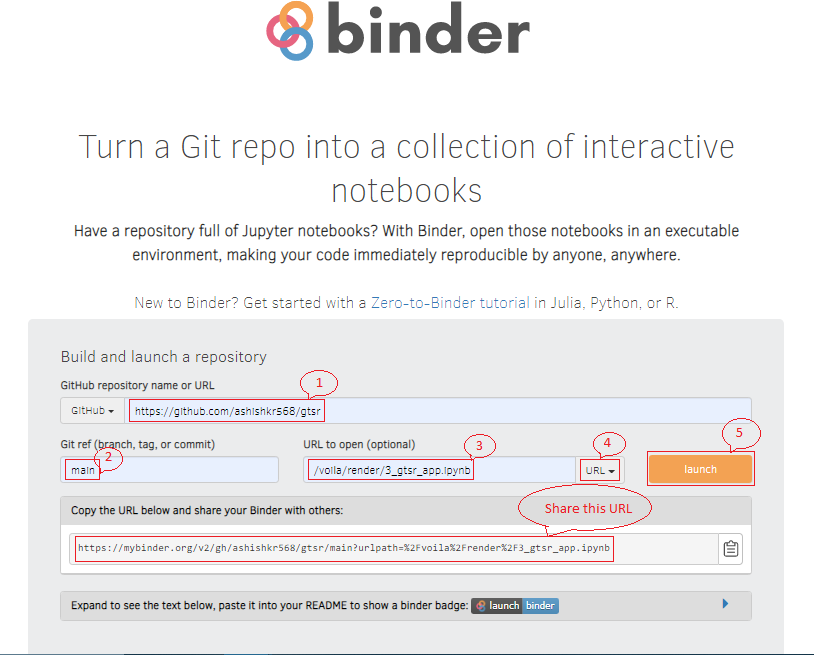
To launch this application, We need to fill in the details as per the below image in Binder and click on “launch”. This will build a standalone web application and the generated URL can be shared with anyone.
Note: Since Binder is meant for interactive and ephemeral interactive coding, meaning that it is ideally suited for relatively short sessions. Refer its usage guidelines
Test model using the deployed application
Below is the screenshot of our deployed application. It only displays the Markdown text in Jupyter Notebook along with the application.
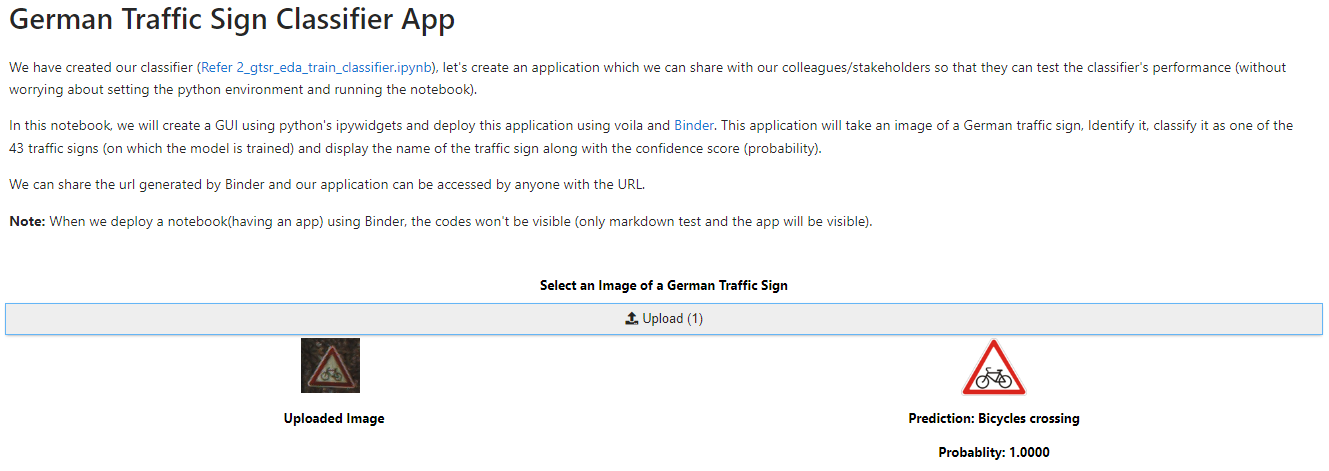
A user can upload an image from the test set and get the prediction along with the confidence score(probability).
This project is also a demonstration of how a data scientist can prototype their work during the initial phase of projects.
Note: Currently this application is accepting one image at a time, but one can modify it to accept multiple files or files in other formats based on requirements.
Source Code
Click Here to go to the source code.
Hope you enjoyed reading. Happy Learning..!!